
DCFR Insight 58 / Data Center Economics + Cost Planning
Data Center Development Cost: The Complete Capital Stack
Cost per megawatt is useful only after the megawatt, scope, location, date, density, delivery model, and uncertainty are defined. A decision-grade budget reconciles the complete capital stack instead of comparing attractive ratios with different numerators.

Define the megawatt before pricing it
State whether the denominator is information-technology load, critical IT load, utility import, transformer nameplate, generator capacity, contracted capacity, or a future campus target. Then distinguish initial, committed, fitted, energized, tested, occupied, and ultimate capacity. A 100 MW site with only 20 MW fitted is not comparable with 100 MW of commissioned IT load, and utility-side MW cannot be substituted casually for IT MW. Record redundancy, power-usage assumptions, density, operating mode, and whether shared infrastructure is allocated to Phase 1 or the ultimate campus. The denominator must remain traceable through every estimate and approval.
Draw the capital boundary before selecting a benchmark
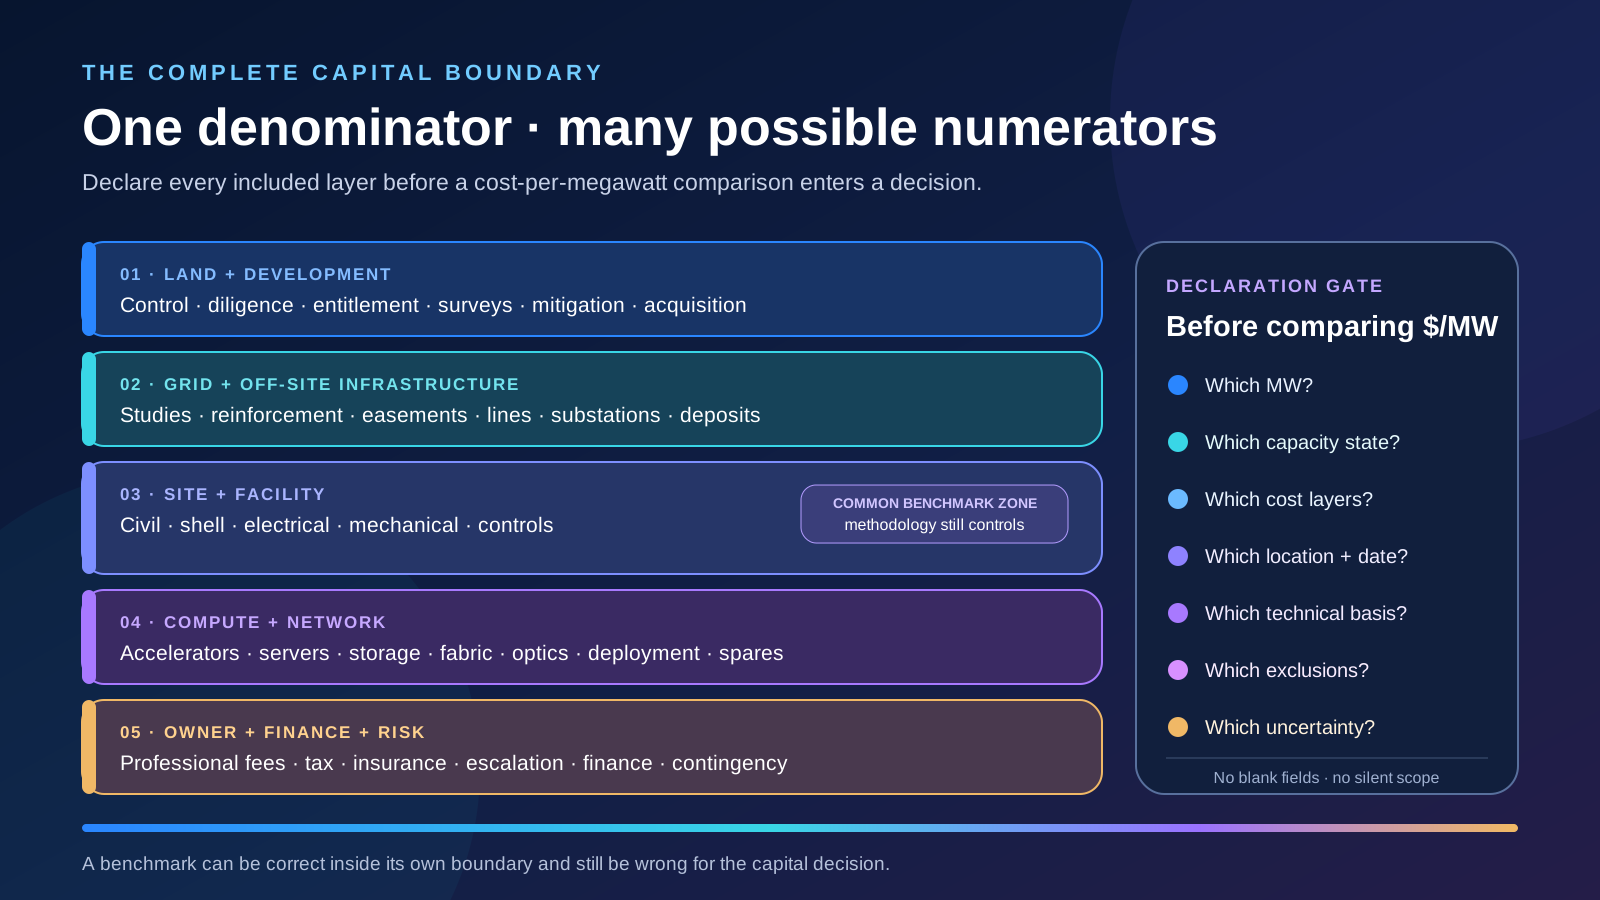
Build one cost map covering land and control, diligence, entitlement, abnormal ground, site and civil work, utility interconnection and off-site reinforcement, substations, shell and architecture, electrical systems, mechanical and cooling systems, fire and controls, security, network, active information technology, professional services, owner costs, insurance, tax, escalation, financing, contingency, commissioning, spares, and transition to operations. Mark what is included, excluded, allocated, supplied by the utility, paid by a tenant, or carried elsewhere. A headline construction benchmark can be valid within its boundary and still be unusable as an all-in development budget.
Normalize published benchmarks before comparing them
Turner & Townsend's 2025 methodology models a 30–50 MW IT-load, air-cooled, build-to-suit hyperscale facility. Its benchmark includes shell and core, architectural and MEP fit-out, MEP equipment, general-contractor preliminaries, margin, and contingency, while excluding client-direct costs, land, utility works, site works, abnormal groundworks, active IT, office fit-out and fiber, and professional fees. JLL reports average global construction cost rising from $7.7 million per MW in 2020 to $10.7 million in 2025 and forecasts $11.3 million in 2026, while its chart identifies the boundary as shell and core. Before using either figure, reconcile definition, geography, currency, exchange date, price base, procurement route, taxes, escalation, density, cooling, resilience, labor conditions, and exclusions.
Complete Capital-Boundary Register
| Cost layer | Typical content | Frequent omission | Decision evidence |
|---|---|---|---|
| Land + development | Control, diligence, entitlement, surveys and mitigation | Acquisition tax, conditions, community commitments | Executed rights, approvals matrix and risk-adjusted land basis |
| Grid + off-site | Studies, interconnection, reinforcement, easements and utility substation | Utility-paid scope assumed without agreement | Written scope, responsibility, milestones, security and energization date |
| Site + facility | Civil, shell, electrical, mechanical, controls, security and commissioning | Abnormal ground, temporary works, escalation and interface scope | Quantities, design basis, market-tested packages and schedule |
| Compute + network | Servers, accelerators, storage, fabric, optics and deployment | Refresh, spares, software enablement and stranded cluster capacity | Bill of material, workload, performance, delivery and acceptance basis |
| Owner + finance + risk | Professional services, insurance, tax, financing, contingency and reserve | Interest during delay, cancellation and working capital | Cash flow, risk model, commercial terms and governance |
Every line must identify owner, price date, currency, inclusion, exclusion, allocation rule, uncertainty, and capacity state.
Understand what dominates the facility budget
For its United States model, Turner & Townsend allocates an air-cooled facility cost as 54% electrical, 22% mechanical, 14% shell and architectural, and 10% general-contractor preliminaries. The comparable liquid-cooled allocation is 48% electrical, 33% mechanical, 9% shell and architectural, and 10% preliminaries. Electrical remains the largest facility category in both cases, but the mechanical share rises materially with liquid cooling. These are model allocations, not universal rules: topology, redundancy, voltage strategy, heat rejection, rack density, local code, utility scope, and packaged or prefabricated systems can all move them.
Treat liquid cooling as a system change, not a line-item premium
Turner & Townsend reports that comparable liquid-cooled projects in the United States averaged 7–10% more than air-cooled facilities at the same IT capacity. The design decision also redistributes cost: coolant distribution, secondary loops, controls, water treatment, leak management, residual air cooling, structural loading, installation tolerances, and commissioning must work with the rack, electrical architecture, and heat-rejection plant. Higher first cost may support denser compute or reduce another requirement, but only a common workload, availability, capacity, and lifecycle basis can reveal the trade. Applying a generic percentage to an unchanged air-cooled design misses the interfaces that create both value and risk.
Keep the building and the compute on separate ledgers
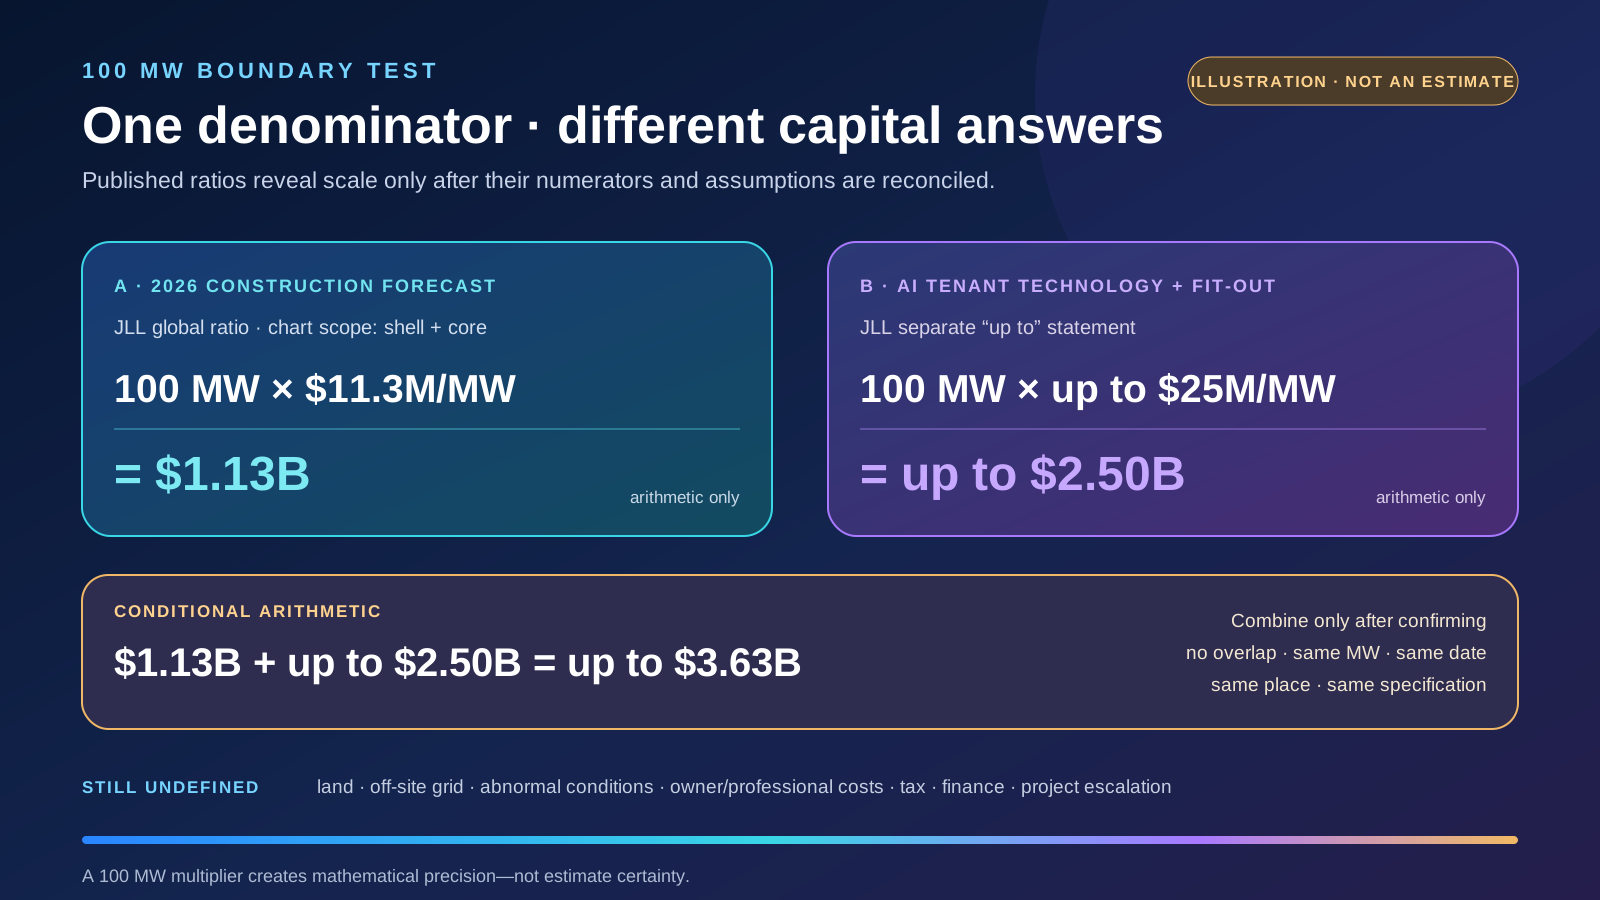
JLL notes that tenant technology fit-out for AI can cost up to $25 million per MW, separate from its construction chart. Active GPUs, CPUs, servers, storage, networking, optical equipment, software-enablement work, and deployment labor can therefore exceed the physical facility investment. A March 2026 IREN filing illustrates the boundary distinction directly: it describes a data-center layer of land, power, substations, buildings, and cooling, and a compute layer of GPUs, CPUs, storage, servers, and networking. Maintain linked but separate facility, utility, and compute budgets so procurement, useful life, depreciation, refresh cycles, warranties, and delivery risk remain visible.
Use 100 MW arithmetic to expose scope—not to declare a price
Multiplying JLL's 2026 global construction forecast of $11.3 million per MW by 100 MW produces $1.13 billion. Multiplying its statement that AI tenant technology fit-out can reach $25 million per MW by the same denominator produces up to $2.50 billion. A simple sum reaches up to $3.63 billion, but it is not a project estimate and is valid only if the two scopes are confirmed non-overlapping and the MW, date, geography, specification, and delivery assumptions match. Land, off-site grid work, abnormal conditions, financing, tax, owner costs, escalation, and other exclusions still require project evidence. The exercise demonstrates how an apparently precise ratio can omit billions or double-count them.
Stress-test location, density, and delivery model
Turner & Townsend's 2025 market comparison ranges from $9.5 per watt in Charlotte to $15.2 per watt in Tokyo—a spread of about 60% before project-specific differences are considered. The comparison signals market sensitivity; it does not prove that one city is better for a specific campus. Test labor productivity and availability, material logistics, code, tariffs, taxes, exchange rates, utility ownership boundaries, seismic and climate demands, water, schedule, site constraints, and contractor capacity. Repeat the analysis for air and liquid cooling, conventional and prefabricated delivery, low and high rack density, single-building and campus phasing, and local versus imported equipment.
Benchmark Reconciliation Gate
| Published figure | What it can support | What must be reconciled | Unsafe use |
|---|---|---|---|
| Turner & Townsend construction benchmark | Market comparison for its defined 30–50 MW build-to-suit model | Location, date, scope, cooling, density, resilience and exclusions | Calling it an all-in campus or compute cost |
| US air/liquid allocation | Early view of facility-category distribution | Comparable IT capacity, topology and packaged-system boundaries | Applying percentages as a project bill of quantities |
| JLL $11.3M/MW 2026 forecast | Order-of-magnitude global construction context | Shell/core boundary, geography, capacity and project specification | Multiplying ultimate campus MW and calling the result a budget |
| AI technology up to $25M/MW | Scale test for tenant technology exposure | Hardware mix, useful load, network, life cycle and fit-out overlap | Combining it with construction before scope reconciliation |
| Project control estimate | Capital authorization when maturity matches the decision | Basis, quantities, quotes, schedule, escalation, risk and cash flow | Treating a single-point total as certainty |
Match estimate confidence to the capital decision
A screening allowance should not authorize equipment release or acquisition closing. At each gate, publish the basis of estimate, quantities, design maturity, supplier quotations, market date, escalation, productivity, schedule, inclusions, exclusions, allowances, contingency method, risk register, and reconciliation to the prior estimate. Separate contractor contingency, owner contingency, quantified risk allowance, and management reserve; a benchmark that already includes general-contractor contingency cannot accept another blanket percentage without reconciliation. Use independent review to test scope completeness, technical assumptions, estimate methodology, schedule-cost integration, arithmetic, and optimism. When evidence changes, preserve the bridge from the previous budget rather than overwriting the history.
Control cash and lifecycle—not only the capital total
Map land payments, utility deposits, long-lead releases, design, enabling works, equipment fabrication, construction, commissioning, technology delivery, tax, interest, and contingency draw to the integrated schedule. Identify cancellation exposure, deposits at risk, foreign exchange, commodity escalation, warehousing, duplicate temporary systems, and the carrying cost of capacity that cannot yet serve compute. Keep operating energy, maintenance, replacement, refresh, and decommissioning on a separate whole-life ledger; their ranking depends on service life, utilization, efficiency, technology cycles, and energy price. Report estimate-at-completion, cash flow, accepted capacity, cost of delay, and lifecycle basis together.
Early screening checklist
What to verify before advancing this site.
- The MW denominator states IT, critical, utility, nameplate, fitted, energized, commissioned, and ultimate capacity correctly
- One boundary register covers land, grid, site, facility, compute, network, owner, finance, tax, escalation, and risk
- Every benchmark is normalized for scope, date, geography, currency, cooling, density, resilience, and delivery model
- Utility and off-site works have written ownership, funding, security, scope, and milestone evidence
- Electrical, mechanical, shell, and preliminaries are tested from project quantities—not generic percentages alone
- Air- and liquid-cooled options use the same workload, capacity, availability, and lifecycle comparison basis
- Facility, utility, and active-compute budgets remain linked but separately controlled
- The 100 MW arithmetic is labeled as an illustration and is never represented as a project estimate
- Estimate maturity, exclusions, allowances, contingency, reserve, and independent review match the capital gate
- Schedule, escalation, cash flow, cancellation exposure, cost of delay, and accepted capacity are reported together
- Each budget update preserves a quantified reconciliation to the prior approved basis
What DCFR would flag
Risks surfaced at the screening stage.
DCFR would flag any $/MW comparison that does not define the megawatt, capacity state, capital boundary, location, price date, cooling and resilience basis, active-IT treatment, utility scope, escalation, exclusions, contingency, and estimate maturity—or that presents illustrative benchmark arithmetic as a project budget.
Professional confirmation required
Items requiring licensed validation.
Confirm cost boundary, capacity definition, design basis, utility responsibility, tax, currency, escalation, contingency, estimate maturity, procurement scope, financing, insurance, commissioning, active-IT content, accounting treatment, and approval authority with the owner, operator, tenants, utility, cost consultant, designers, contractors, technology suppliers, tax and finance advisers, insurers, counsel, and independent reviewer.
Final takeaway
The most dangerous data-center cost number is not the high one; it is the precise-looking $/MW figure whose numerator and denominator describe different projects.
Screen up to 20 candidate sites before selecting one for the full DCFR report.
Each DCFR Report Package includes a preliminary 20-site comparison PDF / export package plus one selected planning-grade feasibility report.