
DCFR Insight 61 / Clean Power + Location Strategy
Where Can a 100 MW Data Center Reach 24/7 Clean Power?
The best clean-power location is not the place with the greenest annual percentage. It is the specific grid node where 100 MW can be delivered, matched hour by hour, expanded responsibly, and operated through drought, outage, congestion, and extreme weather.

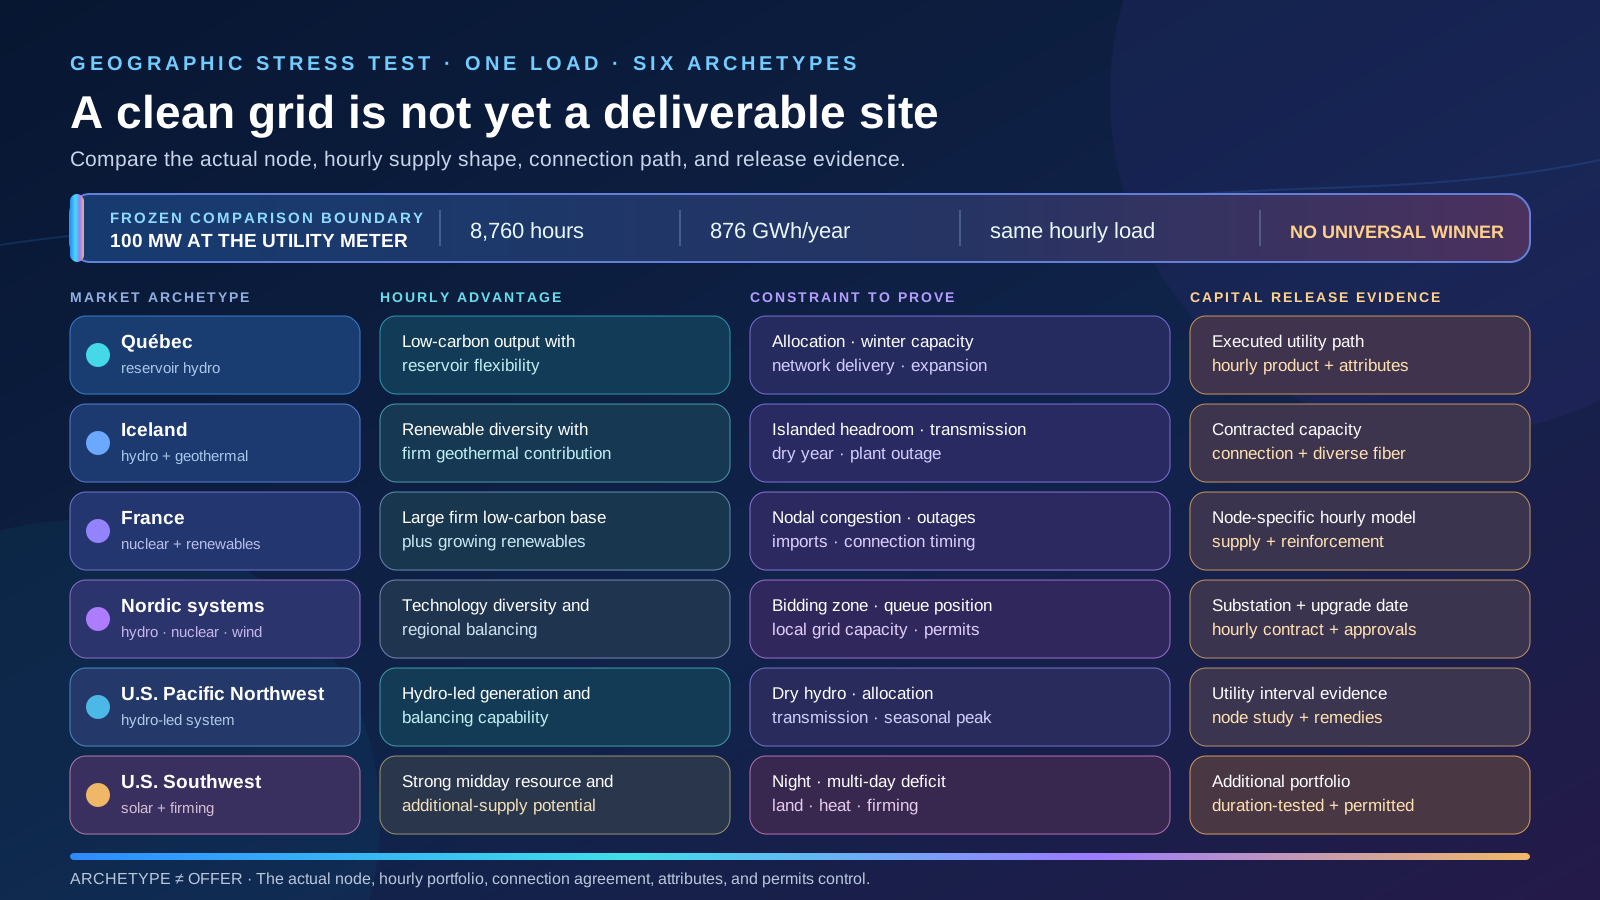
Freeze one 100 MW boundary before comparing geography
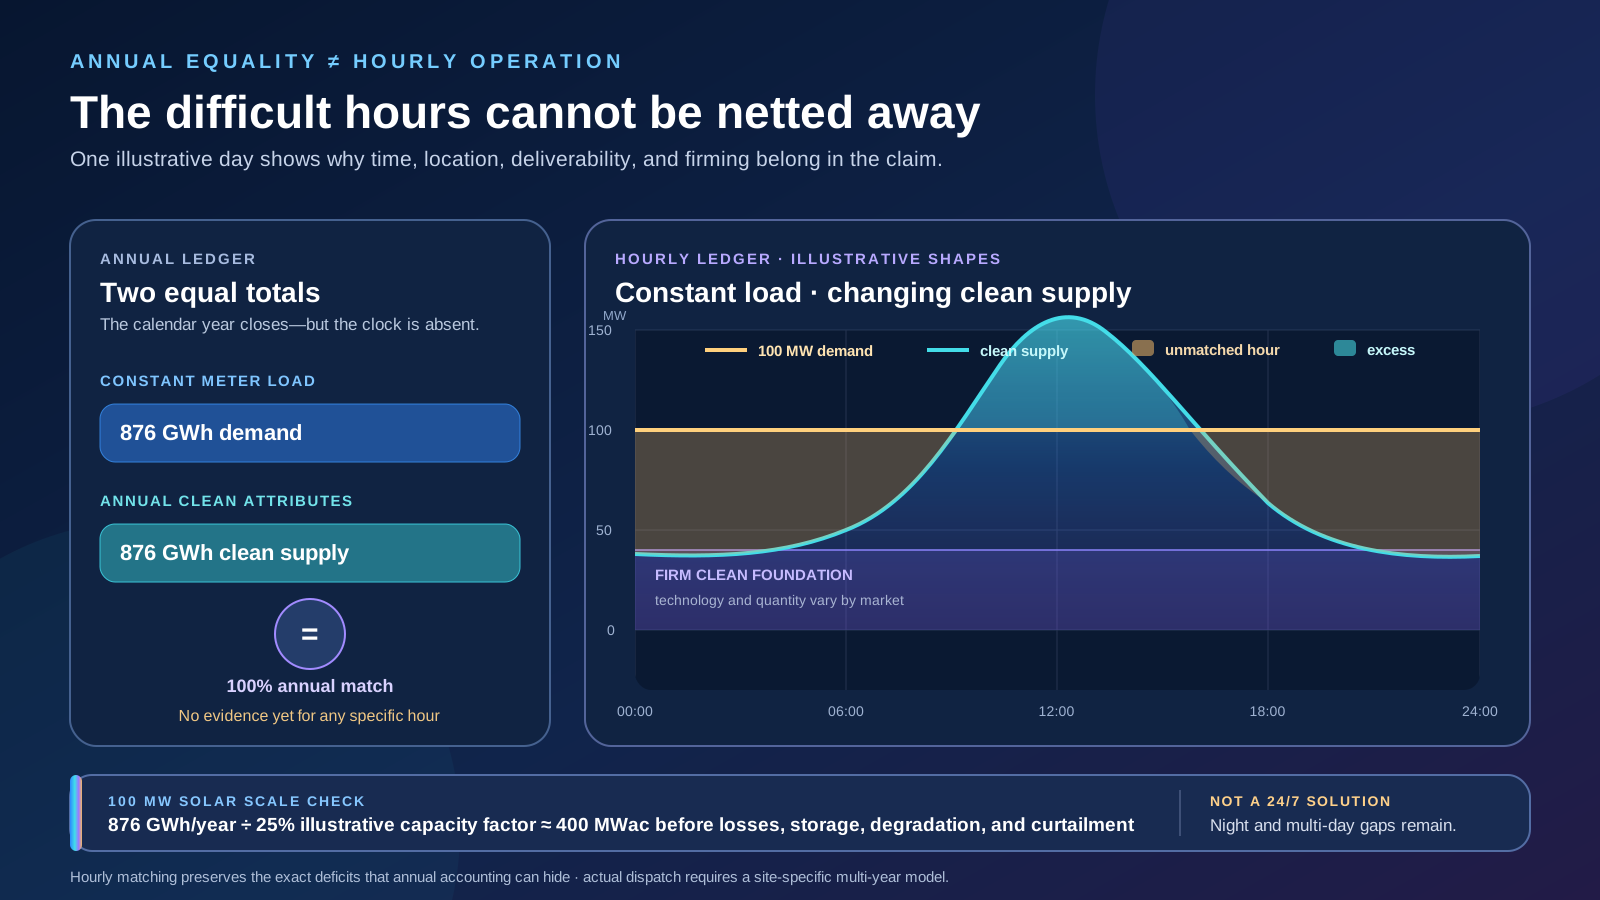
This stress test uses one constant 100 MW load at the utility meter for 8,760 hours: 876 GWh per year before considering storage losses or an on-site export claim. If 100 MW instead means information-technology load, the meter requirement rises with facility overhead—for example, to 963.6 GWh at a 1.10 annual PUE or 1,051.2 GWh at 1.20. State the metering point, demand profile, capacity state, facility overhead, backup operation, storage boundary, and exported energy before calculating any clean-power percentage. A site cannot win a comparison whose denominator changes by market.
Distinguish annual procurement from 24/7 carbon-free energy
Annual renewable matching reconciles total purchased attributes with total annual consumption; it does not show whether clean generation was available when the facility operated. A 24/7 carbon-free-energy framework tracks electricity by hour, links supply and consumption to the same relevant grid region, includes all qualifying carbon-free technologies, seeks additional clean supply, and considers wider power-system impact. Report both the annual inventory and the hourly result. Preserve unmatched hours, carbon intensity, imports, curtailment, attribute ownership, residual mix, and generator fuel rather than allowing a favorable annual total to erase difficult operating periods.
Select a node, power product, and delivery path—not a country
National generation statistics are useful screening evidence, not a power offer. At each candidate site, obtain interval load and generation data, an executable interconnection path, network-upgrade scope, loss treatment, curtailment rights, outage history, congestion analysis, expansion rules, tariff, credit terms, attribute transfer, and remedies. Model existing supply separately from new resources enabled by the project. Then stress multiple weather years, low-hydro periods, nuclear or geothermal outages, wind drought, winter and summer peaks, transmission constraints, and delayed generation. Fiber, land, water, climate, workforce, permitting, community acceptance, tax, security, and construction logistics remain site-selection gates even when the electricity is exceptionally clean.
Québec: reservoir hydro is strong, but allocation is the decision
Québec is a powerful archetype because reservoir hydropower can provide low-carbon energy with a different hourly profile from variable solar or wind. Government of Canada data describes Québec's 2022 electricity as nearly all renewable, led by approximately 94% hydro and 5% other renewable sources; Hydro-Québec describes its output as more than 99% clean and renewable. That system profile does not grant a 100 MW project an automatic connection. Hydro-Québec subjects data-center requests above 5 MW to a selection process and forecasts material sector demand growth. The release gate is a written allocation, delivery date, network scope, winter-capacity treatment, attribute chain, expansion right, and operating obligation at the actual site.
Iceland: complementary renewables meet an islanded capacity test
Iceland combines hydropower and geothermal generation—approximately 73% and 27% respectively in the government's national description—creating an unusually high renewable share and a potentially valuable blend of reservoir flexibility and firm geothermal output. The constraint is scale and deliverability within an isolated electricity system. The OECD's 2025 review identifies transmission bottlenecks, limited spare capacity, curtailment or rejected connection requests, and climate exposure in the hydro system. A credible case therefore needs a contracted quantity, connection study, transmission work, dry-year and plant-outage analysis, reserve treatment, expansion conditions, and a fiber-diversity plan that recognizes the island geography.
France: a low-carbon national mix still requires nodal proof
RTE reports that 95.2% of mainland French electricity generation was low carbon in 2025, with nuclear and renewable output totaling 521.1 TWh and average generation emissions intensity of 19.6 gCO2e per kWh. This makes France a strong firm-low-carbon archetype, but the national average is not an hourly supply contract for a particular campus. Model nuclear availability, renewable variability, imports and exports, local congestion, maintenance periods, connection works, curtailment, and the source and retirement of attributes. Land, water, heat-reuse opportunity, environmental approval, and the time required for grid reinforcement can decide the site even when the national carbon result is excellent.
Six-Archetype Geographic Stress Test
| Archetype | Hourly advantage | Constraint to prove | Release evidence |
|---|---|---|---|
| Québec reservoir hydro | Low-carbon output with reservoir flexibility | Allocation, winter capacity, network delivery and expansion | Selected project, executed utility path, hourly product and attribute rights |
| Iceland hydro + geothermal | Renewable diversity with firm geothermal contribution | Islanded-system headroom, transmission and dry-year resilience | Contracted capacity, connection work, outage scenarios and diverse fiber |
| France nuclear + renewables | Large firm-low-carbon foundation plus growing renewables | Nodal congestion, outage profile, imports and connection timing | Node-specific hourly model, executable supply and reinforcement scope |
| Nordic hydro + nuclear + wind | Technology and regional-balancing diversity | Bidding-zone exposure, connection queues and local capacity | Substation position, reinforcement schedule, hourly supply and permits |
| U.S. Pacific Northwest hydro | Hydro-led regional generation and balancing capability | Dry hydro, transmission, allocation and seasonal adequacy | Utility interval data, nodal study, upgrades, rights and remedies |
| U.S. Southwest solar + firming | High solar resource and strong midday production | Night, multi-day and seasonal deficits; land and heat | Additional resources, duration-tested storage, firm supply and demand plan |
Screening characteristics only. No archetype receives a universal rank; the actual node, utility agreement, hourly portfolio, attribute chain, permits, and operating limits control the decision.
Nordic systems: diversity helps, while queues move the constraint
Sweden and Finland illustrate a diversified low-carbon archetype rather than one interchangeable Nordic market. Sweden's July 2025–June 2026 statistics show large hydro, nuclear, and wind contributions; Finland reports that 95% of its 2024 electricity production was fossil free, with nuclear its largest source and wind continuing to grow. Diversity can improve the hourly fit, climate can reduce cooling energy, and regional trading can broaden balancing. Yet the Nordic transmission operators report rapidly growing grid-connection requests, while Fingrid describes nearly 5 GW of signed industrial connections and areas where capacity is reserved. Screen the bidding zone and substation—not a Nordic label—and prove queue position, reinforcement, price-zone exposure, local acceptance, and heat or water constraints.
Pacific Northwest: hydro-led power does not eliminate grid risk
Washington is a useful hydro-led United States archetype. The U.S. Energy Information Administration reports a comparatively low-emissions, hydro-dominant state generation profile, but state production is not identical to a utility's delivered hourly product: imports, exports, federal power allocation, transmission limits, dry-year conditions, fish and river obligations, local resource adequacy, and customer class all matter. Bonneville Power Administration's planned transmission additions demonstrate both investment and the scale of regional demand pressure. Require the serving utility's hourly resource and emissions method, a nodal delivery study, dry-hydro and peak-season scenarios, network-upgrade responsibility, attribute rights, and a schedule consistent with the actual transmission program.
U.S. Southwest: abundant solar needs a firm overnight architecture
The Southwest tests the difference between annual surplus and hourly operation most clearly. A constant 100 MW meter load consumes 876 GWh per year. At an illustrative 25% solar capacity factor, annual energy equality requires about 400 MWac of solar before storage, conversion, degradation, curtailment, and transmission losses. NREL's historical utility-scale land-use intensity would put an energy-matched system of that scale in a multi-thousand-acre order of magnitude, subject to technology and site design. Yet annual equality still leaves nights, cloudy periods, seasonal mismatch, and extreme summer peaks. Three- or four-hour battery systems, such as Arizona Public Service's cited projects, can shift solar into the evening; they do not by themselves provide multi-day or seasonal firming. The site needs an integrated portfolio of additional solar, storage, transmission, firm carbon-free supply, flexible compute, and defined residual-grid treatment.
Choose the portfolio that survives the worst hours
Build a multi-year hourly model for each candidate using the same 100 MW meter load, facility response, resource vintage, transmission region, loss convention, and qualifying-technology rules. Report annual matching, hourly carbon-free-energy score, longest and deepest deficit, residual emissions, curtailment, storage duration and cycling, firm clean contribution, demand flexibility, land, water, price, connection date, and expansion headroom. Run outage, drought, heat, cold, congestion, delayed-project, and attribute-failure cases. Release a location only when the utility path, new supply, contracts, permits, attributes, operations, and verification method are executable together. The best geography is the one whose specific node and portfolio remain credible under adverse hours—not the one with the most attractive annual statistic.
24/7 Clean-Power Capital Gate
| Gate | Minimum evidence | Failure hidden by annual matching | Required decision |
|---|---|---|---|
| Load boundary | Meter point, 8,760-hour profile, PUE, growth, storage and export rules | The denominator changes between markets | Freeze one comparable load product |
| Grid delivery | Node, region, capacity, upgrades, losses, congestion, curtailment and date | Clean generation exists but cannot reach the load | Execute the physical delivery path |
| Clean supply | Technology, project, vintage, additionality, hourly output and outage rights | Certificates cover totals without changing difficult hours | Contract traceable hourly resources |
| Firming + flexibility | Storage duration, firm clean supply, transmission and controllable workload | Midday surplus is counted against overnight deficit | Close worst-hour and multi-day gaps |
| Site viability | Land, water, climate, fiber, permits, community, cost and expansion | A clean grid masks an undeliverable campus | Release only the complete site-and-power case |
| Verification | Interval meters, time zone, factors, attribute retirement, exceptions and assurance | A claimed score cannot be reproduced | Approve an auditable operating method |
The capital decision needs physical delivery, commercial rights, hourly performance, and site feasibility together; an annual certificate ledger is not a substitute.
Early screening checklist
What to verify before advancing this site.
- The 100 MW boundary states the meter point, hourly profile, PUE treatment, storage, exports, and capacity state
- All candidates use the same 876 GWh annual load and identical hourly operating assumptions
- Annual renewable matching and hourly local carbon-free-energy performance are reported separately
- The grid node, balancing region, losses, congestion, curtailment, imports, and upgrade scope are defined
- The utility capacity quantity, delivery date, security, dependencies, expansion right, and remedies are executable
- Every clean resource identifies technology, project, vintage, additionality, interval output, attributes, and outage rights
- Multi-year hourly modeling includes drought, heat, cold, low wind, plant outage, delayed resource, and transmission constraints
- Storage states power, energy, duration, efficiency, degradation, cycling, charging source, and unavailable periods
- Firm clean supply, transmission, and flexible compute close the longest and deepest hourly gaps
- Land, water, climate, fiber, permitting, workforce, community, tax, security, and construction remain site gates
- Interval meters, time zones, emissions factors, attribute retirement, exceptions, and assurance form an auditable method
- No country, region, or annual generation percentage is presented as a universal winning location
What DCFR would flag
Risks surfaced at the screening stage.
DCFR would flag a '24/7 clean' location selected from a national annual generation percentage, certificate total, or solar resource map without one frozen 100 MW load boundary, node-specific deliverability, hourly matching, additionality, worst-period firming, land and water impacts, executable utility capacity, attribute control, and an auditable operating method.
Professional confirmation required
Items requiring licensed validation.
Confirm load boundary, qualifying carbon-free technologies, grid region, hourly accounting method, emissions factors, additionality, attributes, interconnection, transmission losses, curtailment, resource adequacy, storage, demand flexibility, generator use, land, water, environmental and planning approvals, fiber, tax, cost, contracts, assurance, and public claims with the owner, operator, serving utility, grid operator, generators, storage and technology suppliers, licensed engineers, energy-market advisers, authorities, community representatives, counsel, financiers, insurers, and independent verifier.
Final takeaway
There is no universally best clean-power geography: the winning case is the specific grid node, resource portfolio, and site whose 8,760-hour performance and delivery rights survive the hardest operating conditions.
Screen up to 20 candidate sites before selecting one for the full DCFR report.
Each DCFR Report Package includes a preliminary 20-site comparison PDF / export package plus one selected planning-grade feasibility report.